Troubleshooting Java Applications
A Practical Guide for troubleshooting Java applications using debugging and profiling techniques
Troubleshooting Java applications is a critical skill for backend and full‑stack developers. When systems grow complex—microservices, ORMs, async processing, containers—issues rarely come with clear error messages. Instead, you must observe, compare, and reason.
Definition: "Troubleshooting means understanding how a system behaves, comparing that to how it should behave, and then identifying what’s different."
This article walks through a practical, production‑oriented approach to troubleshooting Java applications, covering debugging, profiling, thread dumps, heap dumps, and distributed tracing.
Understanding App Crashes and Analysing app
Understanding App Crashes
App crashes can be of following 2 types:
App Completely Stops or Crashes
Symptoms:
- OutOfMemoryError, JVM crash, Process terminated
💡 Use a Heap Dump to investigate memory usage, leaks, and object retention.
App Is Running but Not Responding
Symptoms:
- Requests hang, High latency, CPU spikes or stalls
💡 Use a Thread Dump to understand thread states, locks, and deadlocks.
Analysing app by Reading Code
Reading code is inherently difficult because it happens in two dimensions:
-
Vertical flow – reading code top to bottom
-
Depth exploration – diving into methods, frameworks, and libraries
→ Troubleshooting complements code reading by showing how the code actually behaves at runtime.
Debugging Java applications techniques
How Java Debugging Works
When you run a Java app in debug mode, the JVM starts with special flags that allow debugger connections. Your IDE communicates with the JVM using JDWP (Java Debug Wire Protocol).
This allows you to - Pause execution, Step through code, Inspect variables, and Modify runtime values.
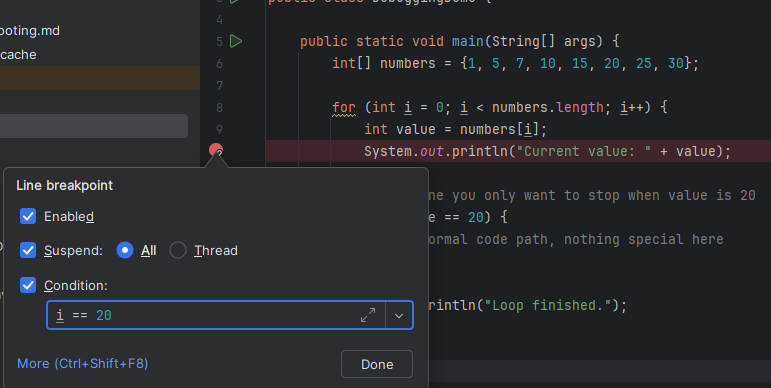
Conditional Breakpoints
A conditional breakpoint pauses execution only when a condition is met.
Example use cases:
-
Break only when variable
i == 20 -
Stop on the
nth iteration
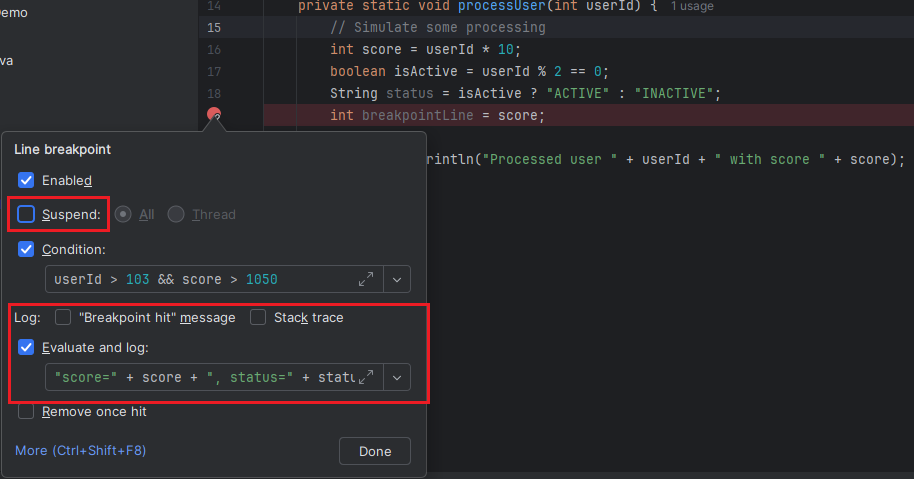
Non‑Suspending Breakpoints with Logging
Instead of stopping execution, you can log values when a breakpoint is hit. This is extremely useful when:
-
Debugging loops
-
Avoiding performance impact
-
Mimicking lightweight tracing
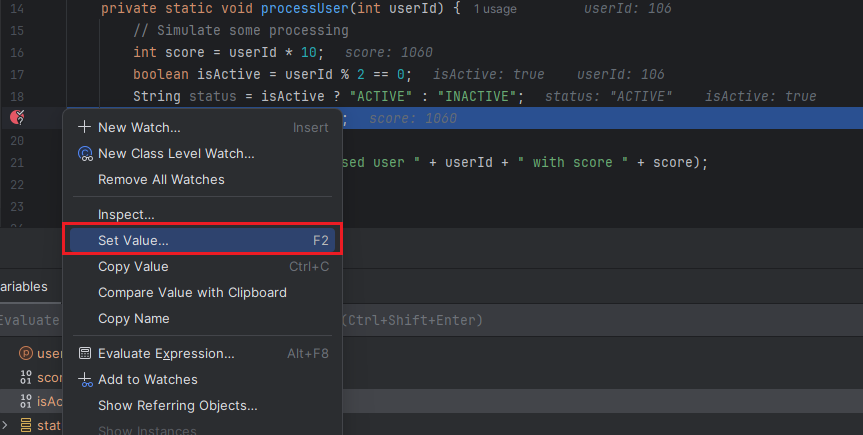
Dynamically Modifying Variables
Modern IDEs allow you to change variable values at runtime during debugging—useful for testing edge cases without restarting the app.
Understanding Memory Issues
When there is a memory leak in your app, the used memory keeps growing continuously. GC tries to deallocate unused data from memory but it does too few. Eventually the app crashes with OutOfMemoryError. Below example shows the difference between a normal and an abnormal behaviour.
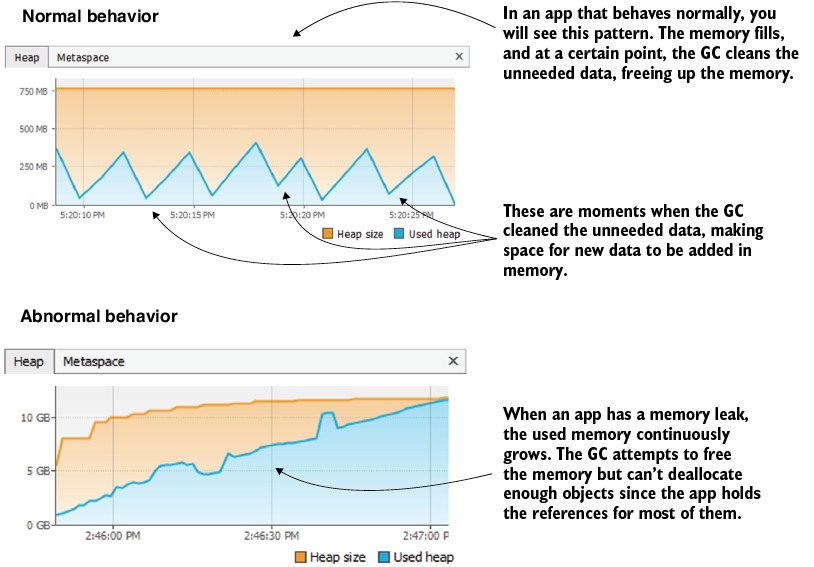
Picture source: Troubleshooting Java book by Laurențiu Spilcă
Profiling Java Applications with VisualVM
Profiling helps answer the question - Where is my application spending time and memory? In this article we are using VisualVM to profile which is a powerful free tool.
Setting up VisualVM
-
Download VisualVM from the official site
-
Extract it locally
-
Update JDK path in etc/visualvm.conf
visualvm_jdkhome="C:\Program Files\Amazon Corretto\jdk25.0.1_8"- Run VisualVM from the bin directory
Sampling vs Profiling (Instrumentation)
Sampling
Sampling periodically observes stack traces with minimal overhead.
It helps identify:
-
What code executes
-
Which methods consume most time
-
CPU vs waiting time
💡 Sampling is ideal for initial investigation.
Profiling (Instrumentation)
Profiling instruments bytecode to capture fine‑grained execution details.
-
More detailed information
-
Higher overhead
-
Must be limited to specific packages
💡 Use profiling only after sampling narrows down the problem area.
Applying Profiling in Practice
If Running web service, set the VM Option as follows: -Djava.rmi.server.hostname=localhost
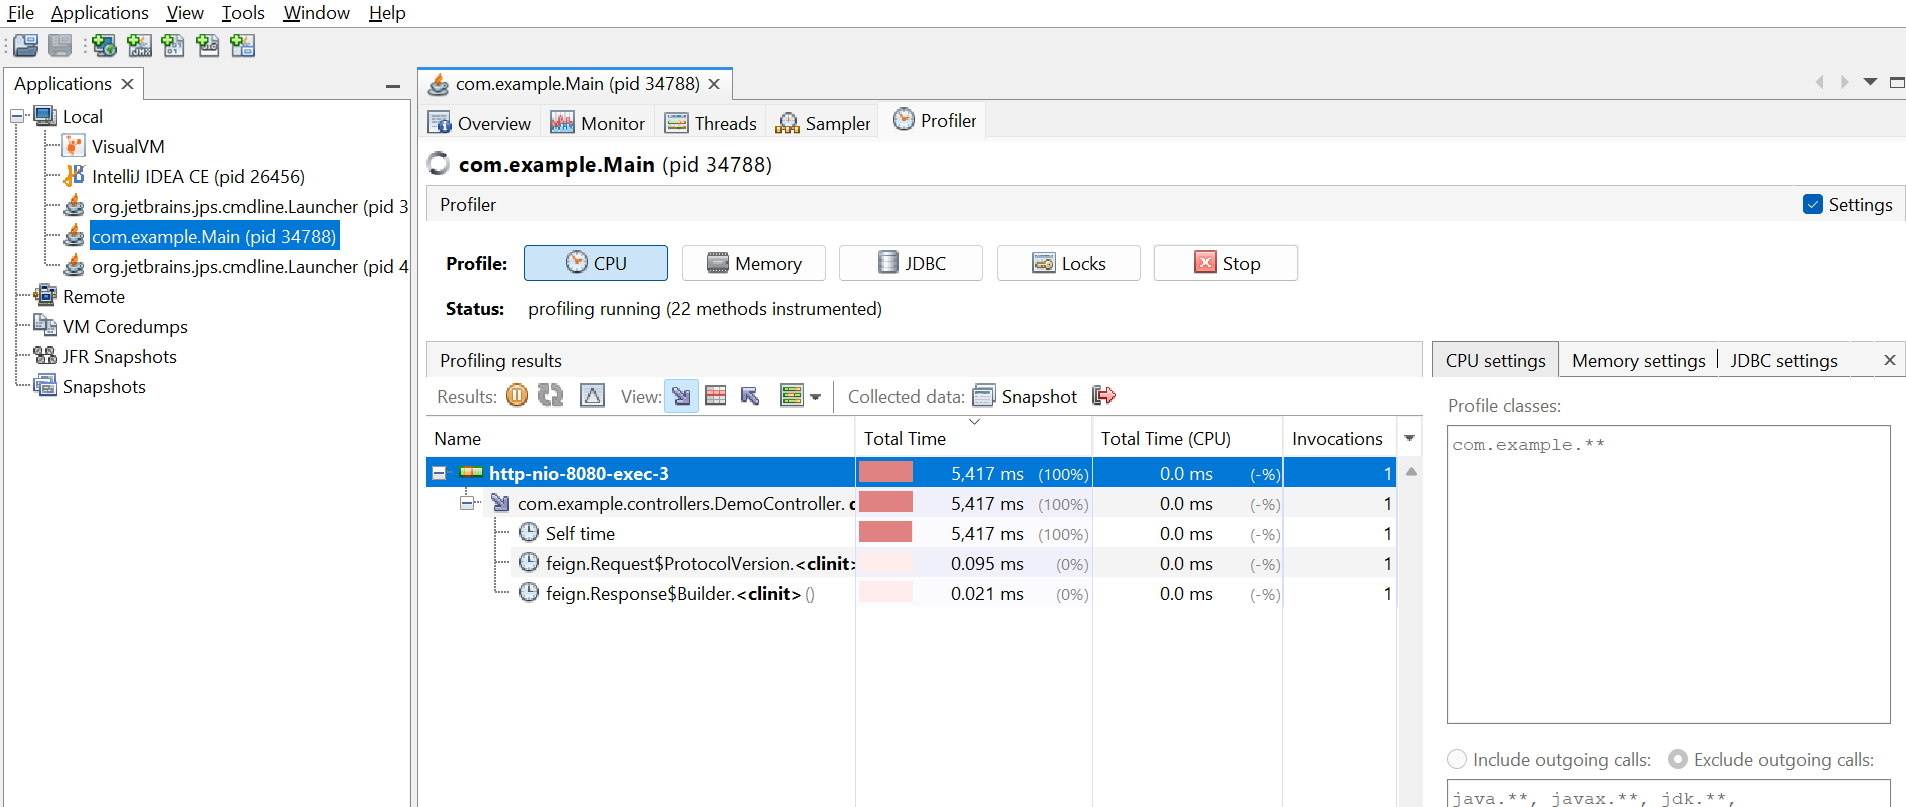
CPU Profiling
Use CPU profiling to:
-
Identify slow methods
-
Investigate latency issues
-
Analyze call stacks
JDBC Profiling
JDBC profiling reveals:
-
SQL execution frequency
-
Slow queries
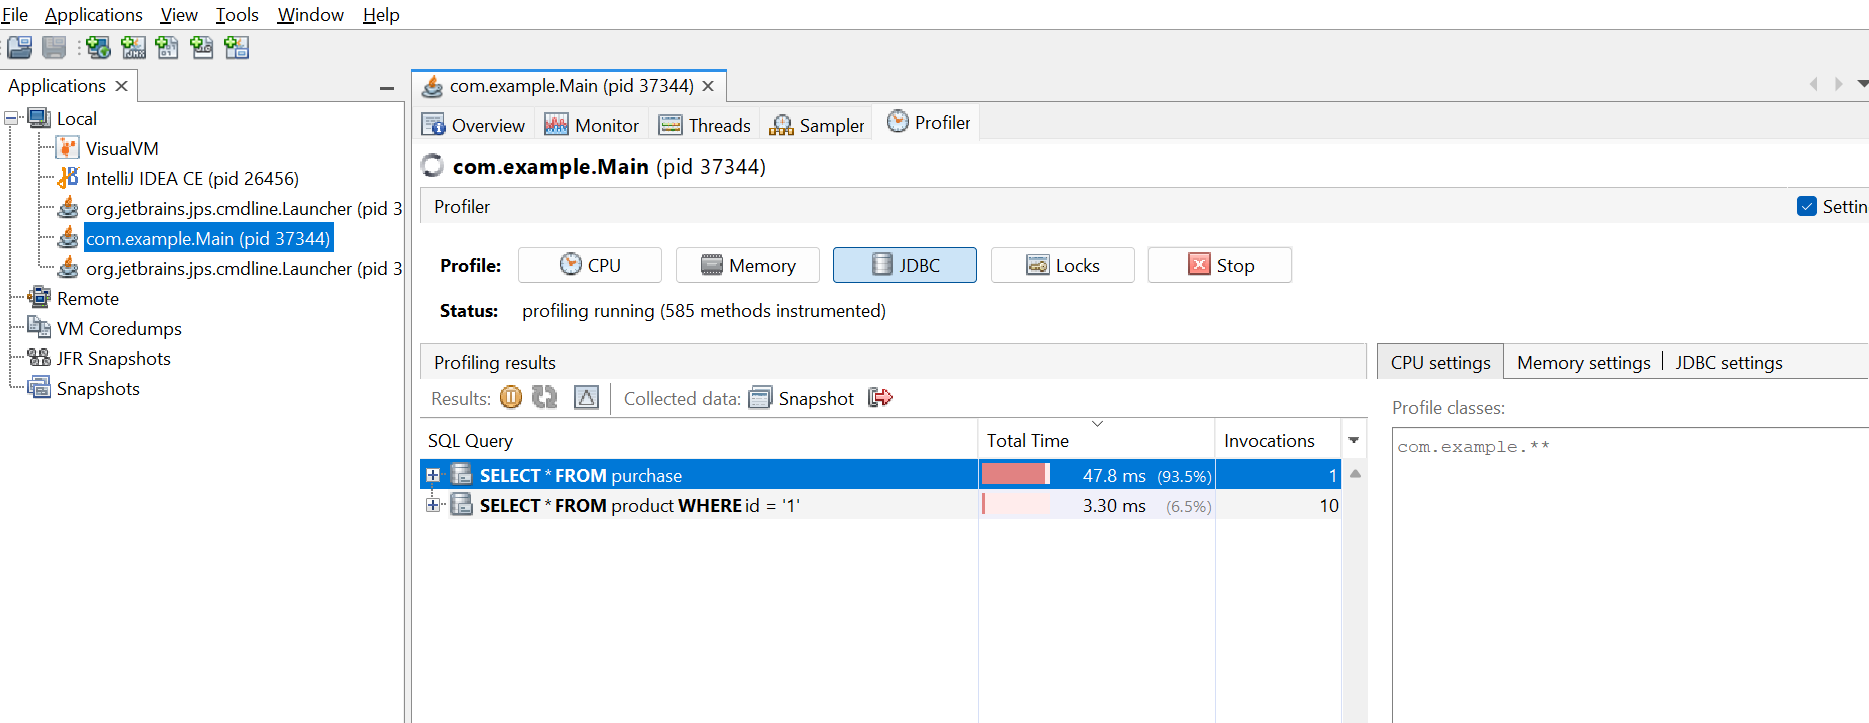
⚠️ When using Hibernate, query counts may appear lower due to batching and caching.
Investigating Latency and Locks
If total execution time is much higher than CPU time, the application is likely waiting.
Common causes:
-
Thread contention
-
Locks
-
I/O waits
-
Database calls
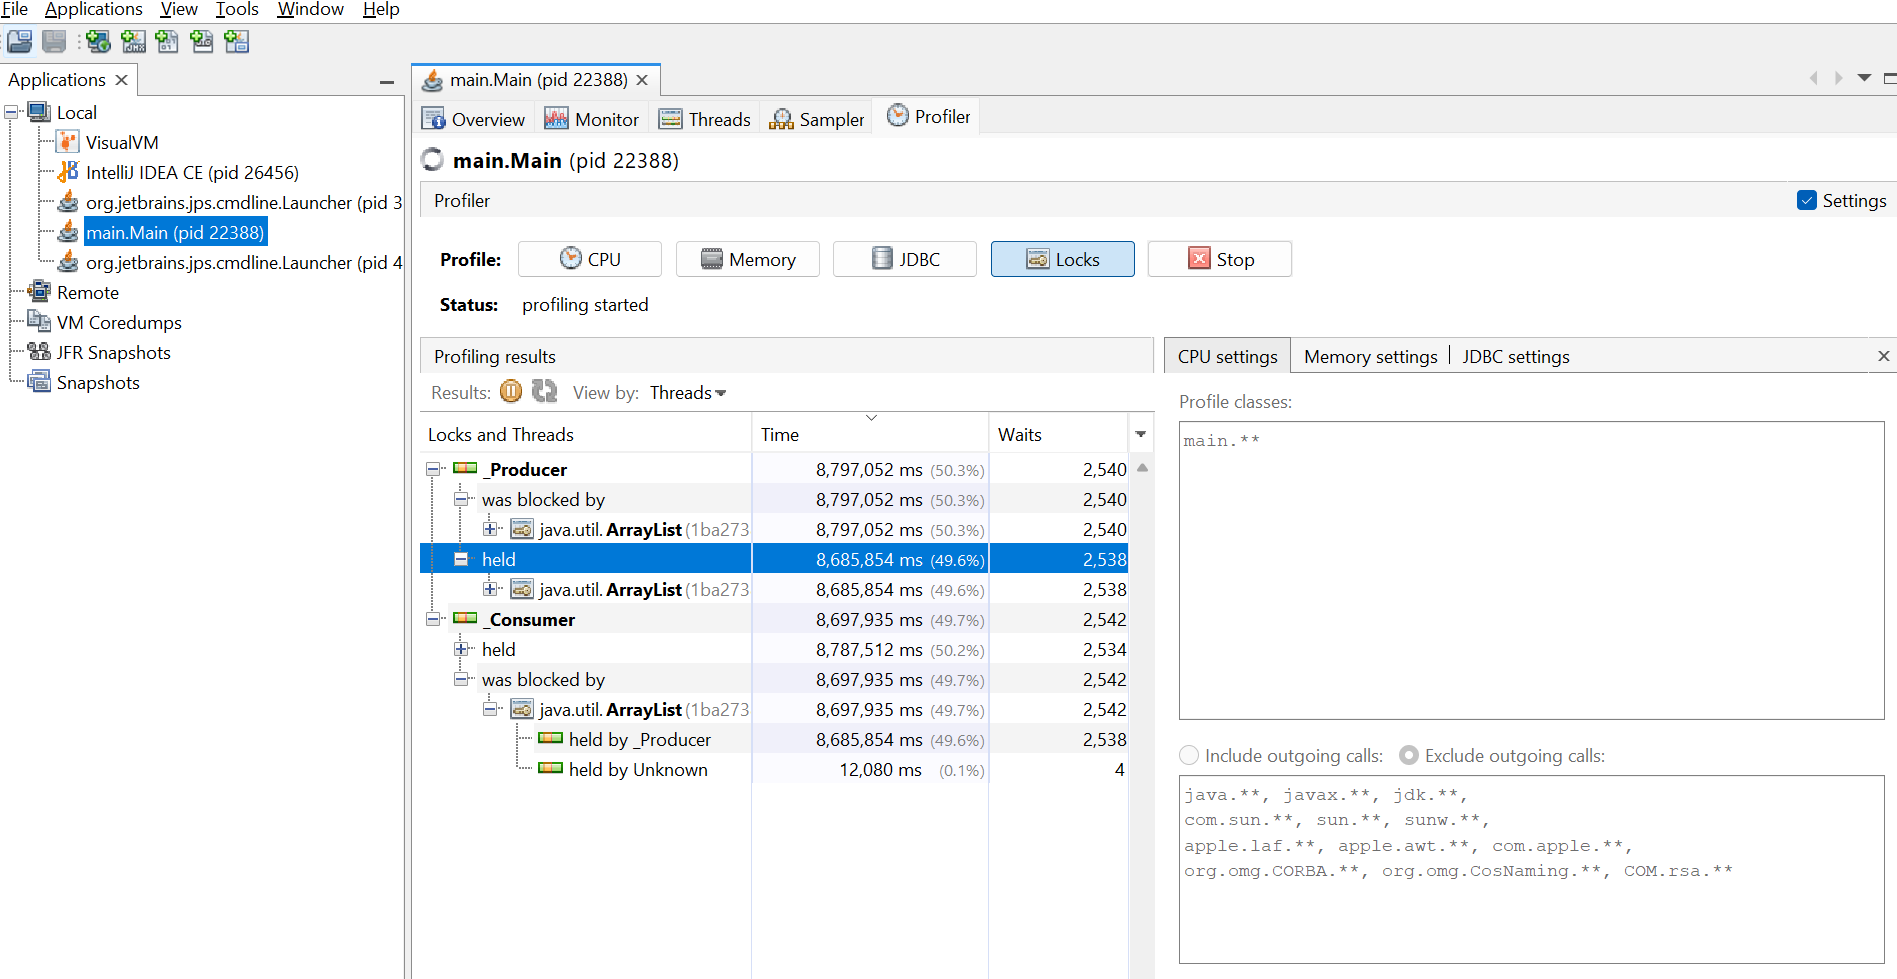
📸 Screenshot: Lock contention view that helps in finding DeadLock
This is where thread dumps become invaluable.
Thread Dumps
A thread dump captures the state of all JVM threads at a point in time.
It helps diagnose:
-
Deadlocks
-
Thread starvation
-
High CPU usage
-
Stuck requests
-
Zombie Threads
- Zombie threads are threads that appear runnable but do no useful work. Common causes: Infinite loops, Busy waiting, Improper synchronization. Thread dumps help identify such patterns.
Thread dump can be collected using multiple ways:
-
Using VisualVM
-
Using CommandLine
Get Thread dump using VisualVM
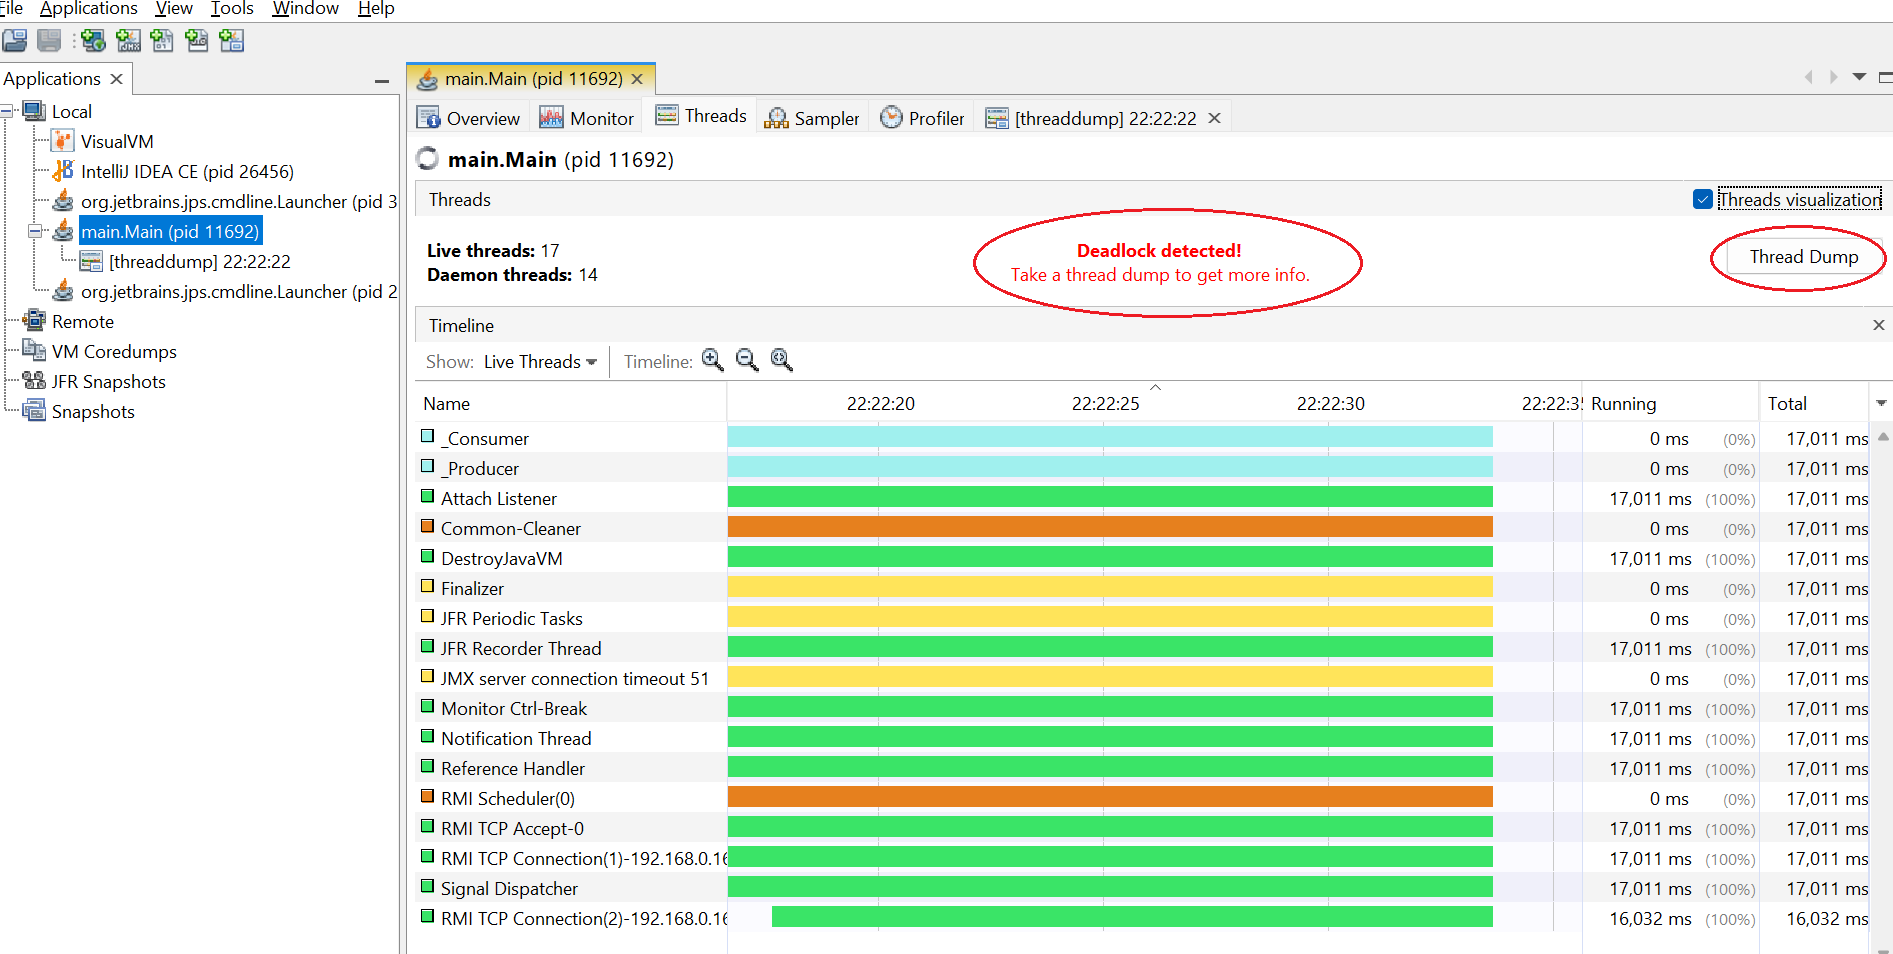
📸 Screenshot: Thread dump overview
Collecting Thread dump using CommandLine**
- Step 1: Find Process ID
jps -l📸 Screenshot: jps output
- Step 2: Capture Thread Dump and save into some file in some location(e.g. stack_trace.tdump)
jstack <PID> > C:\stack_trace.tdump-
Step 3: Analyze Using Tools such as VisualVM
Memory Profiling and Heap Dumps
Profiling memory works only when the app is running and responsive.
But what if:
-
The app crashes immediately?
-
The issue occurs only in production?
👉 This is where heap dumps shine.
What Is a Heap Dump?
A heap dump is a snapshot of all objects in JVM memory at a specific moment, including:
-
Object instances
-
References
-
Retained sizes
Generating Heap Dumps
Option 1: Automatically on OOM
Add JVM flags:
-XX:+HeapDumpOnOutOfMemoryError
-XX:HeapDumpPath=heapdump.bin
Example:
java -jar -XX:+HeapDumpOnOutOfMemoryError -XX:HeapDumpPath=heapdump.bin app.jarOption 2: Using a Profiler
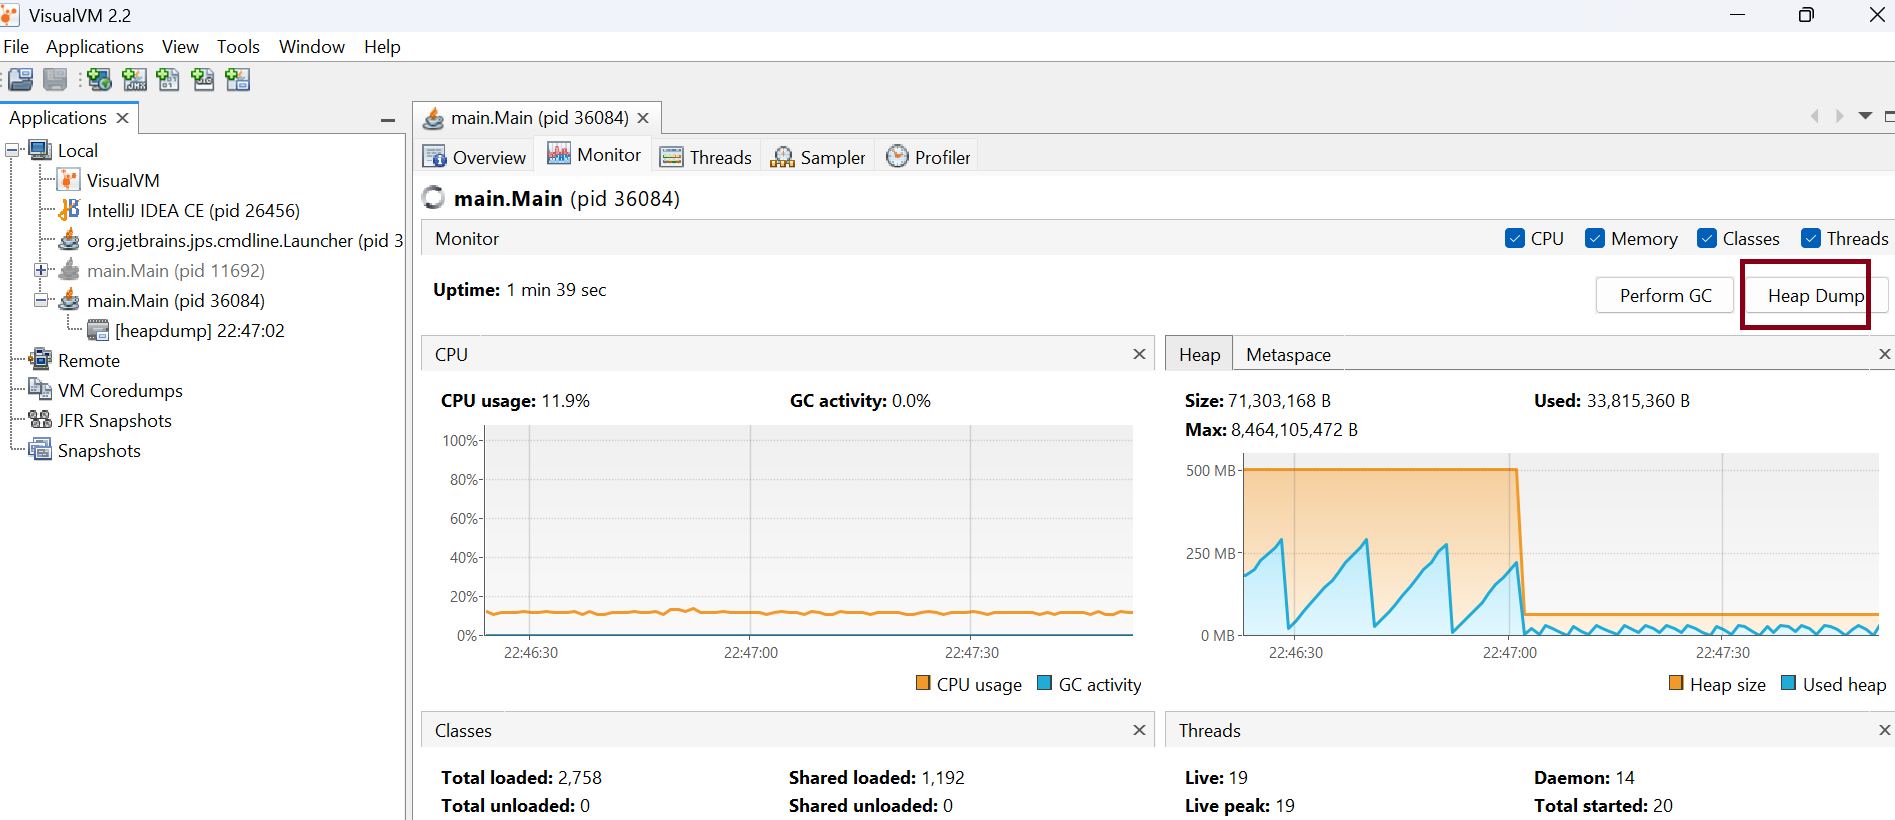
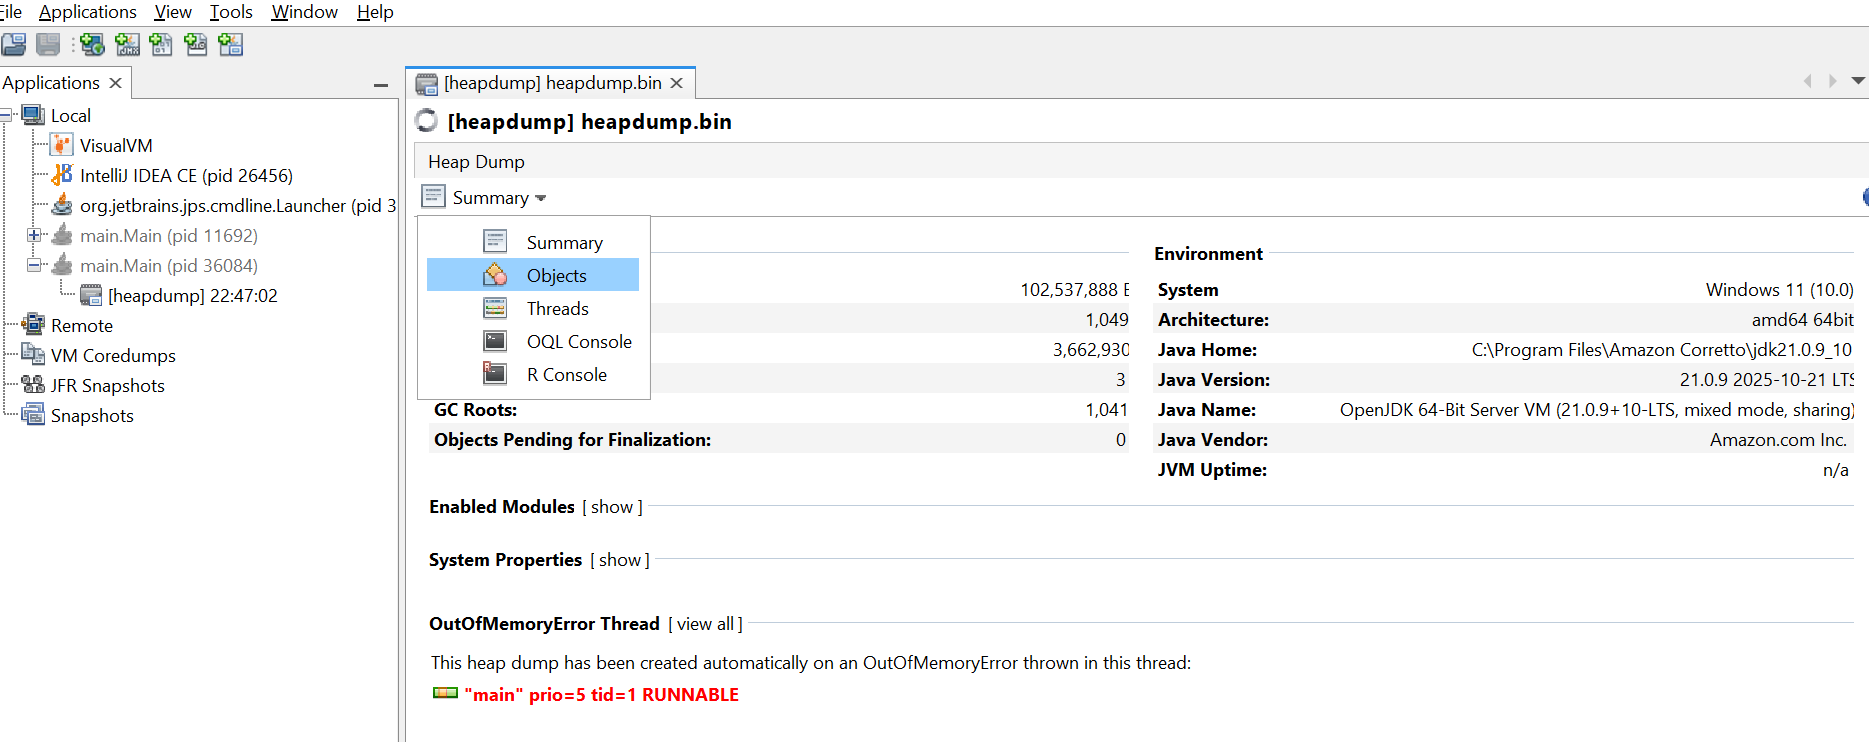
📸 Screenshot: Heap dump via VisualVM
Option 3: Command Line (jmap)
jmap -dump:format=b,file=C:/DA/heapdump.bin <PID>Analyzing Heap Dumps with VisualVM
Steps:
-
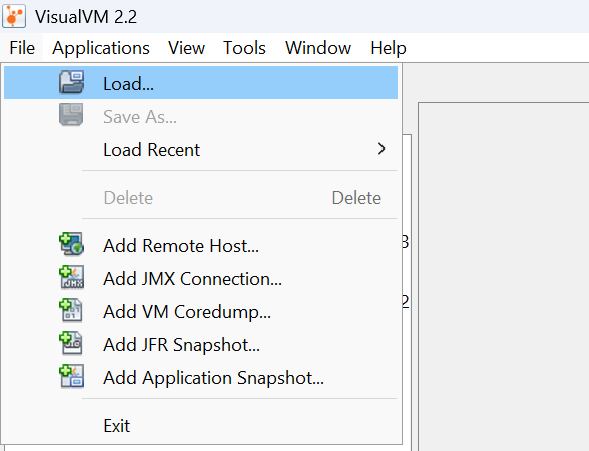
Load heap dump using
File > Loadon VisualVM. -
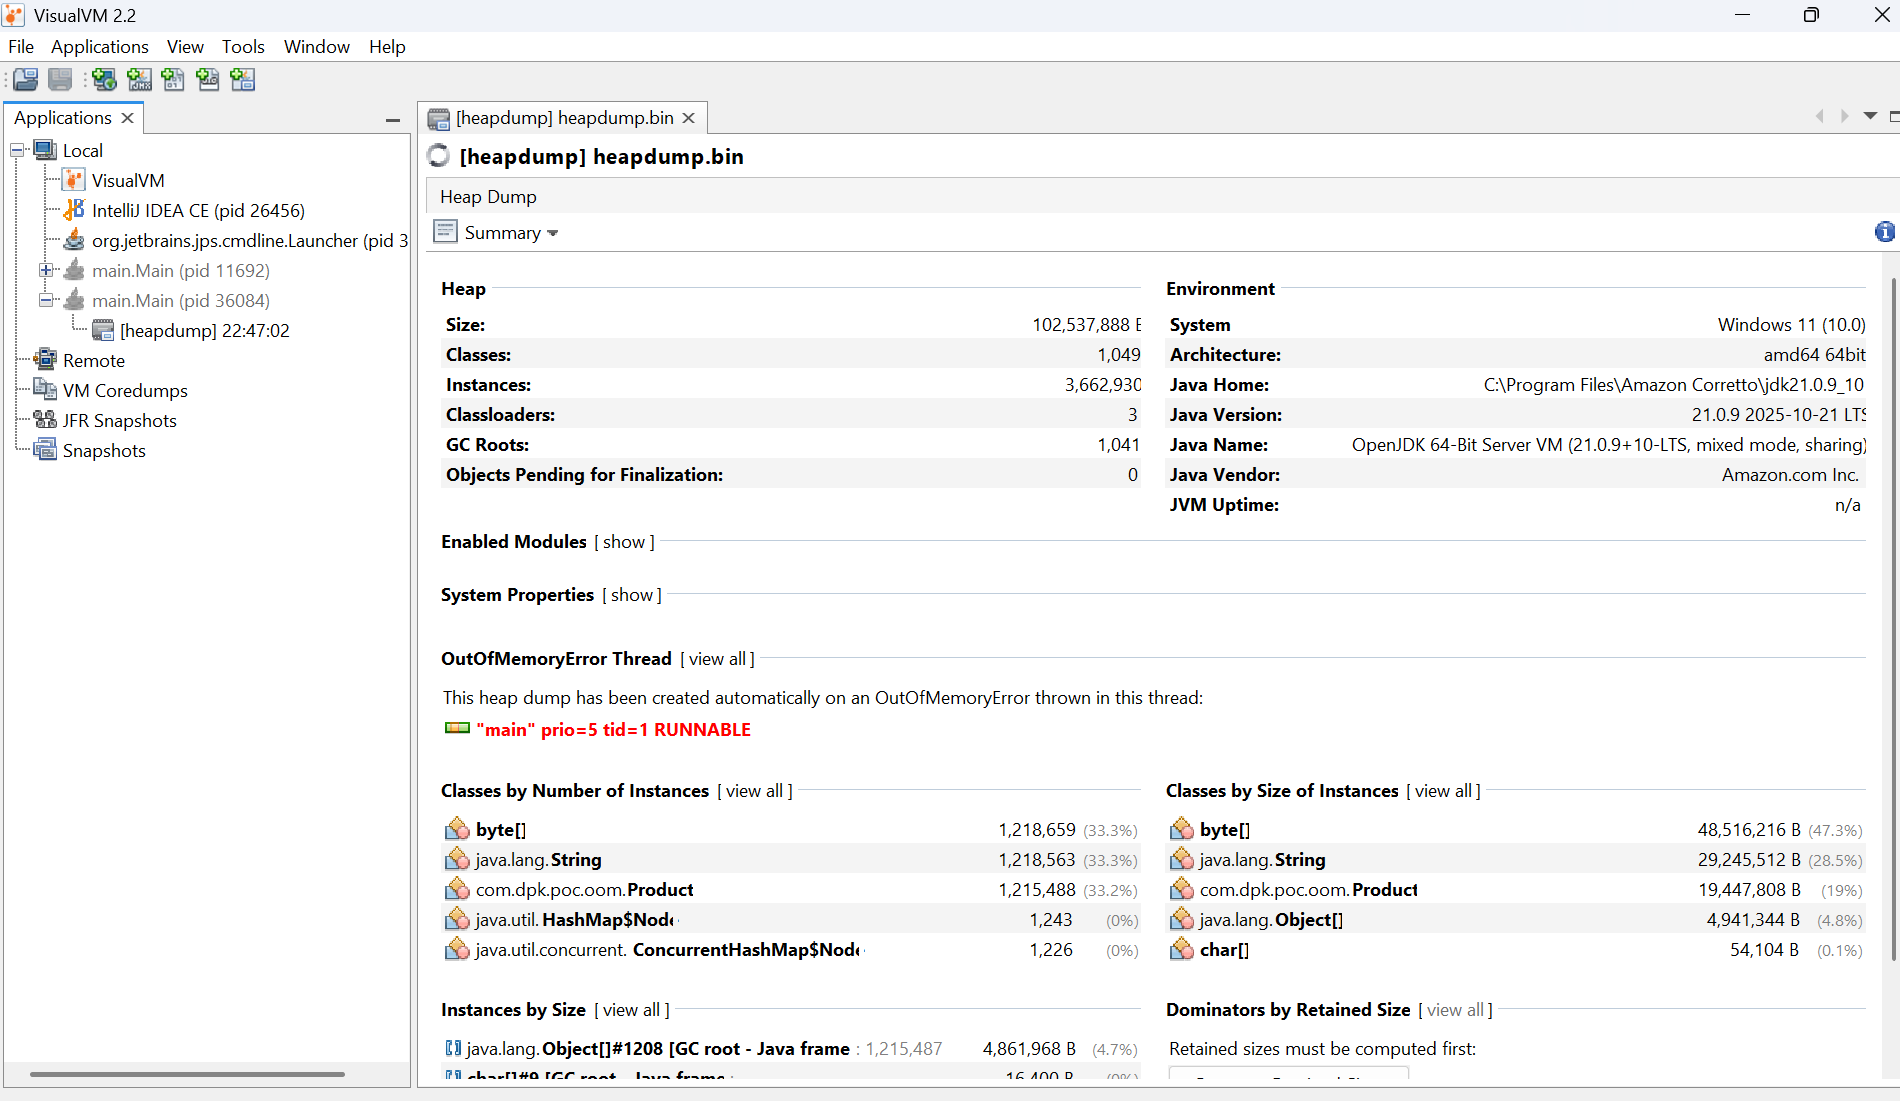
Review HeapDump analysis summary view
-
Explore Objects View
Ignore the primitives and inbuilt object types as they are side-effect and look at the custom data types defined in the project. In this example it’s the Product class.
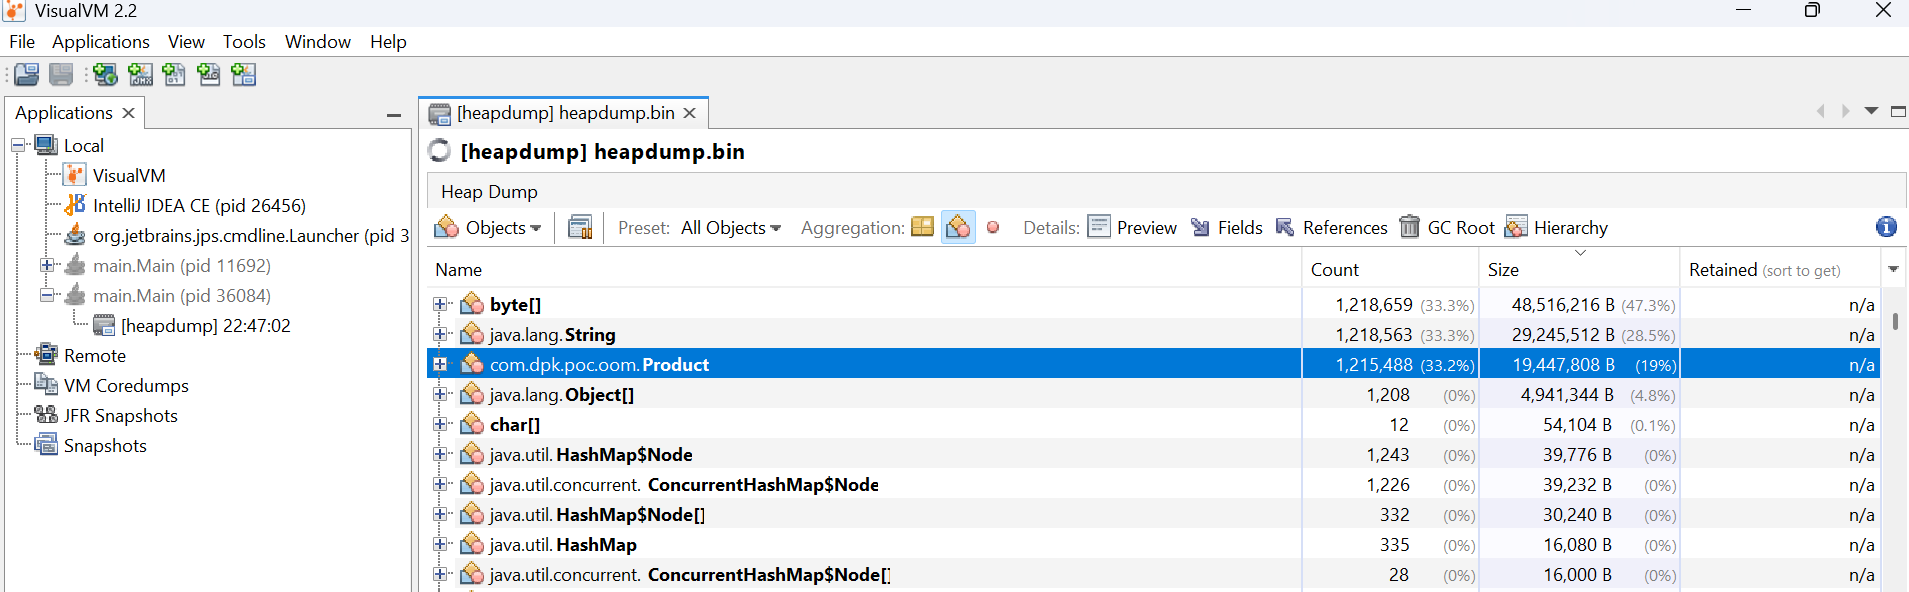
📸 Screenshots: Heap dump analysis views
-
Use OQL Console for advanced queries
Tracing Distributed Systems
In microservices architectures, performance issues often span multiple services.
Distributed Tracing Tools
-
OpenTelemetry – Generates telemetry data (metrics, logs, traces)
-
Jaeger / Zipkin – Collect and visualize traces
How They Work Together
-
OpenTelemetry instruments your Java services
-
Traces are exported to Jaeger or Zipkin
-
Each request appears as a timeline of spans across services
Final Thoughts
Effective Troubleshooting Java applications requires choosing the right tools at the right time.
Rule of thumb:
-
Debugger → Understand logic
-
Profiler → Understand performance
-
Thread dump → Understand concurrency
-
Heap dump → Understand memory
-
Tracing → Understand distributed flows
Mastering these techniques transforms you from someone who reacts to issues into someone who systematically diagnoses them.
Happy troubleshooting 🚀
Did you find this article useful?